It is the total hours of work spent by an employee after he logs in.
It is the passive time spent by the employee during his working hours.
It is the time spent on unproductive applications, apps, URLs during his working hours
It is the active time spent by an employee on his system/desktop.
It is the time spent by an employee on his assigned project’s related files, apps or URLs
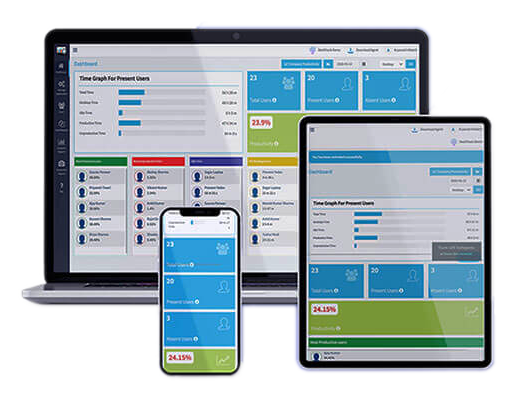
It is the analysis of productivity in percentage
This analysis provides screentime of employees in a week which directly indicates their consistency in productivity delivered during work. Also, the data lists down all the productive apps, URLs visited along with a list of unproductive apps accessed.

This graphical productivity analysis lets an employee do his self assessment on the productivity delivered by him in comparison to other employees in the organization. Such analysis leaves a complete scope for self improvement for the employee knowing his daily performance.
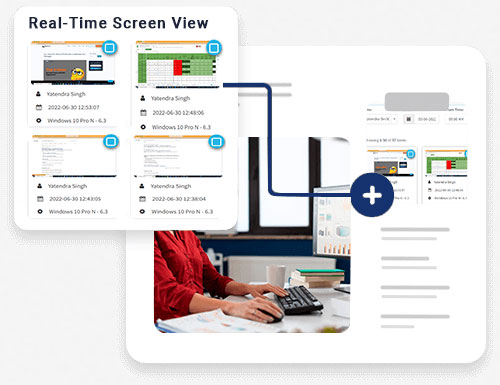
This feature provides real-time sneak peek into employee’s productivity status by capturing screenshots of the data being accessed/worked upon.